By Dr. Mohamad Hushnie Haron*, School of Technology and Engineering Science (STE)
We are swimming in data, but starving for insight. Across engineering environments, sensors are cheaper than ever, storage is abundant, and data flows continuously from systems, machines, and processes. Yet much of this data remains underutilised. Traditional approaches still react to failures or rely on historical trends.
The real value lies in using historical data to predict future states such as fatigue, wear, or efficiency loss, before they become costly problems. For engineers looking to bridge the gap between raw data and predictive insight, the journey often starts with a familiar tool: Microsoft Excel.

What Predictive Insight Means for Engineers
Predictive insight combines physics and data to answer not “What is happening?” but “What will happen next?” For example, vibration sensors on a bearing can be used to estimate its failure threshold in days or operating hours. It relies on three key pillars:
- Physics of Failure – understanding why things break, including stress, strain, and thermodynamics.
- Machine Learning – detecting patterns that physics alone cannot capture, incorporating environmental and operational nuances.
- Prescriptive Action – enabling decisions such as: “Replace part X during the scheduled shutdown next Tuesday.”
Together, these elements transform raw data into actionable engineering decisions that optimise performance, reduce downtime, and cut costs.
Machine Learning for Engineers
Machine learning provides engineers with tools to convert data into knowledge and support better decisions. While enterprise solutions exist, many engineers can take their first steps using Excel, leveraging its built-in Analysis ToolPak, Power Pivot, and even simple Visual Basic for Applications (VBA) scripts to prototype models before scaling up. There are three primary types of machine learning:
- Supervised Learning
- The output is already known, and the algorithm learns to associate input variables with these outputs.
- Example: Bearings classified as “good,” “intermediate,” or “bad” based on vibration, temperature, or current data.
- Excel Approach: Using linear regression or logistic regression via the Analysis ToolPak to predict outcomes based on historical labelled data.
- Unsupervised Learning
- The output is unknown. The model identifies patterns, clusters, or anomalies on its own.
- Example: Vibration readings across multiple machines can be analysed to detect emerging failure modes that were not previously labelled.
- Excel Approach: Using clustering techniques or principal component analysis (PCA) with add-ins to group similar operating conditions and identify outliers.
- Reinforcement Learning
- The model learns through trial and error, receiving rewards or penalties for its actions.
- Example: Predictive maintenance scheduling, where correct actions reduce downtime and receive positive reinforcement, gradually improving decision-making in dynamic environments.

Data Science Pipeline
Engineering machine learning follows a structured pipeline that transforms raw data into actionable insights, and Excel can serve as a powerful tool at each stage, especially for proof-of-concept work:
- Data Acquisition
The first step is to acquire or capture data. Sources include SCADA (Supervisory Control and Data Acquisition) systems, IoT sensors, equipment logs, and CMMS (Computerised Maintenance Management System) platforms. In practical settings, companies often have multiple streams of data coming from sensors and operational systems. Excel’s Power Query feature is invaluable here, allowing engineers to connect to, combine, and refine data from diverse sources without writing complex code. - Data Wrangling
Also known as data cleaning, this step involves aligning datasets, handling missing values, and converting different formats into a consistent structure. Proper data wrangling ensures the dataset is ready for analysis without biases or errors. With Excel, engineers can use functions like IFERROR, VLOOKUP/XLOOKUP, and Power Query’s transformation tools to efficiently clean and shape data. - Feature Engineering
Feature engineering is about selecting the variables that best represent the problem you want to solve. For example, vibration, temperature, or other sensor readings can be engineered into features that indicate equipment health, such as distinguishing a good bearing from a failing one. This step is crucial because the quality of features directly impacts machine learning performance. Excel’s formula bar and pivot tables are surprisingly effective for creating these derived features from raw sensor logs. - Machine Learning
With the selected features, algorithms are trained to recognise patterns. Typically, the dataset is split, commonly 80% for training and 20% for testing. The model learns from the training set to predict outcomes and is validated against the test set to ensure reliability.
In Excel: For engineers starting, this can be done using the Analysis ToolPak for regression models, or by using simple LINEST functions for linear models. For more advanced users, the Excel add-in Analysis ToolPak – VBA allows for custom machine learning experimentation within a spreadsheet environment. - Insight Generation
Finally, the results are analysed to produce actionable insights. This can include predictive metrics like Remaining Useful Life (RUL) or detection of anomalies. The ultimate goal is to transform raw sensor data into knowledge that informs decisions and optimises operations. Excel’s powerful charting and dashboarding capabilities allow engineers to visualise these predictions, making it easy to communicate insights to stakeholders.
Common Machine Learning Approaches in Engineering
Different problems require different algorithms. Examples include:
- Linear and Polynomial Regression – For predicting gradual trends like temperature drift or wear accumulation. (Excel Native)
- Random Forest – Excellent for troubleshooting complex systems and identifying which variables most impact outcomes (e.g., determining which process conditions cause quality defects). (Available via Excel add-ins or external integration)
- LSTM (Long Short-Term Memory) – Neural networks for time-series data, predicting future values based on past sequences. (Typically requiring external tools, but Excel can be used for data prep and result visualisation)
- Autoencoders – Detect anomalies by learning the patterns of “normal” operations and flagging deviations.
The aim is not to choose the most complex algorithm, but the one best suited to the problem. Often, a simple linear regression built in Excel provides 80% of the value with 20% of the effort.
Practical Use Cases in Engineering
Machine learning is most valuable when applied to real-world engineering problems. These examples show how data-driven approaches improve efficiency and enable smarter operations.
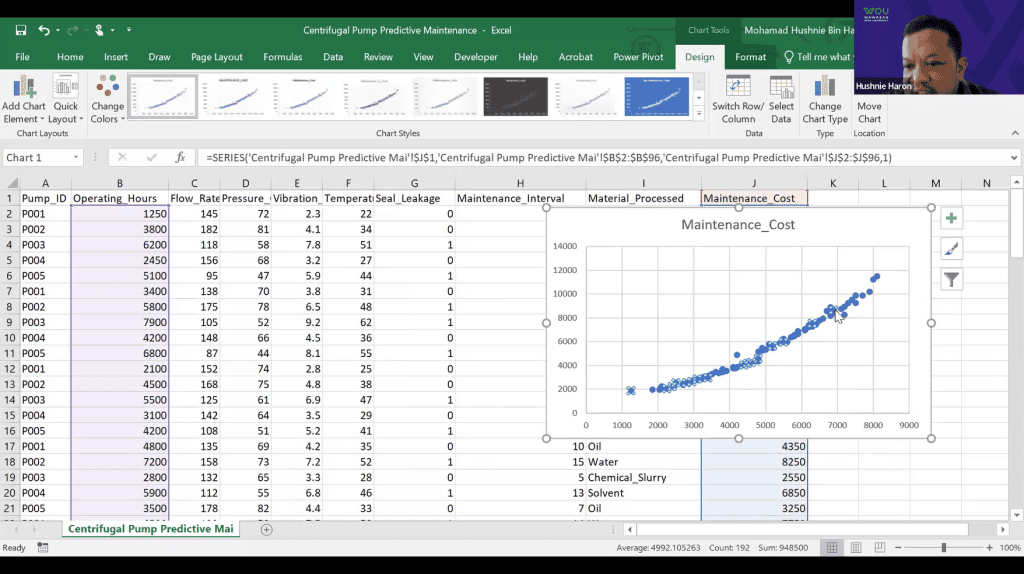
- Predictive Maintenance (Rotating Equipment)
Traditional maintenance often runs equipment to failure or follows fixed schedules. Machine learning changes this by predicting failures before they occur. Data from vibration, temperature, and current sensors is cleaned, engineered, and used to train models. For example, using Excel to plot trend lines and set thresholds can alert engineers: “Bearing degradation is accelerating. Estimated Remaining Useful Life: 300 operating hours.” This proactive approach reduces downtime, cuts maintenance costs, and extends asset life. - Design Optimisation and Digital Twins
Embedding sensors in physical systems, such as strain gauges on wind turbine blades, captures real-world operational data. Engineers can use Excel to perform PCA (Principal Component Analysis) to select the most important variables. These can then be used to build simple neural networks or regression models, or even just interactive dashboards that predict cumulative fatigue damage, optimise designs, and form the basis of digital twins that accurately mirror actual performance. - Process Yield Prediction
Manufacturing quality control has traditionally been reactive, inspecting products only after defects occur. Machine learning enables real-time monitoring of variables such as melt temperature, injection pressure, and screw speed. Engineers can use Excel to run Random Forest classifiers (via add-ins) or simple logistic regressions to determine which variables are causing defects and guide immediate corrective action. AI complements human inspection, improving yield and reducing waste without replacing existing expertise.
From Data to Decision
The engineering landscape is changing. Data is no longer just a by-product of operations—it is a strategic asset. By combining engineering knowledge with machine learning techniques, it is possible to move beyond reporting and into prediction—and ultimately, into action.
The question is no longer whether we have enough data.
It is whether we are ready to use it. And for many engineers, the journey to predictive insight begins with the tool already on their desktop: Microsoft Excel.
About the Author

*Dr. Mohamad Hushnie Haron is a Senior Lecturer at the School of Technology and Engineering Science (STE). A graduate in electrical engineering, he currently oversees STE’s Bachelor of Technology (Honours) in Mechatronic System programme. His areas of expertise include Signal/Data Processing, Embedded Systems, IoT, and Artificial Intelligence.